About this AB test
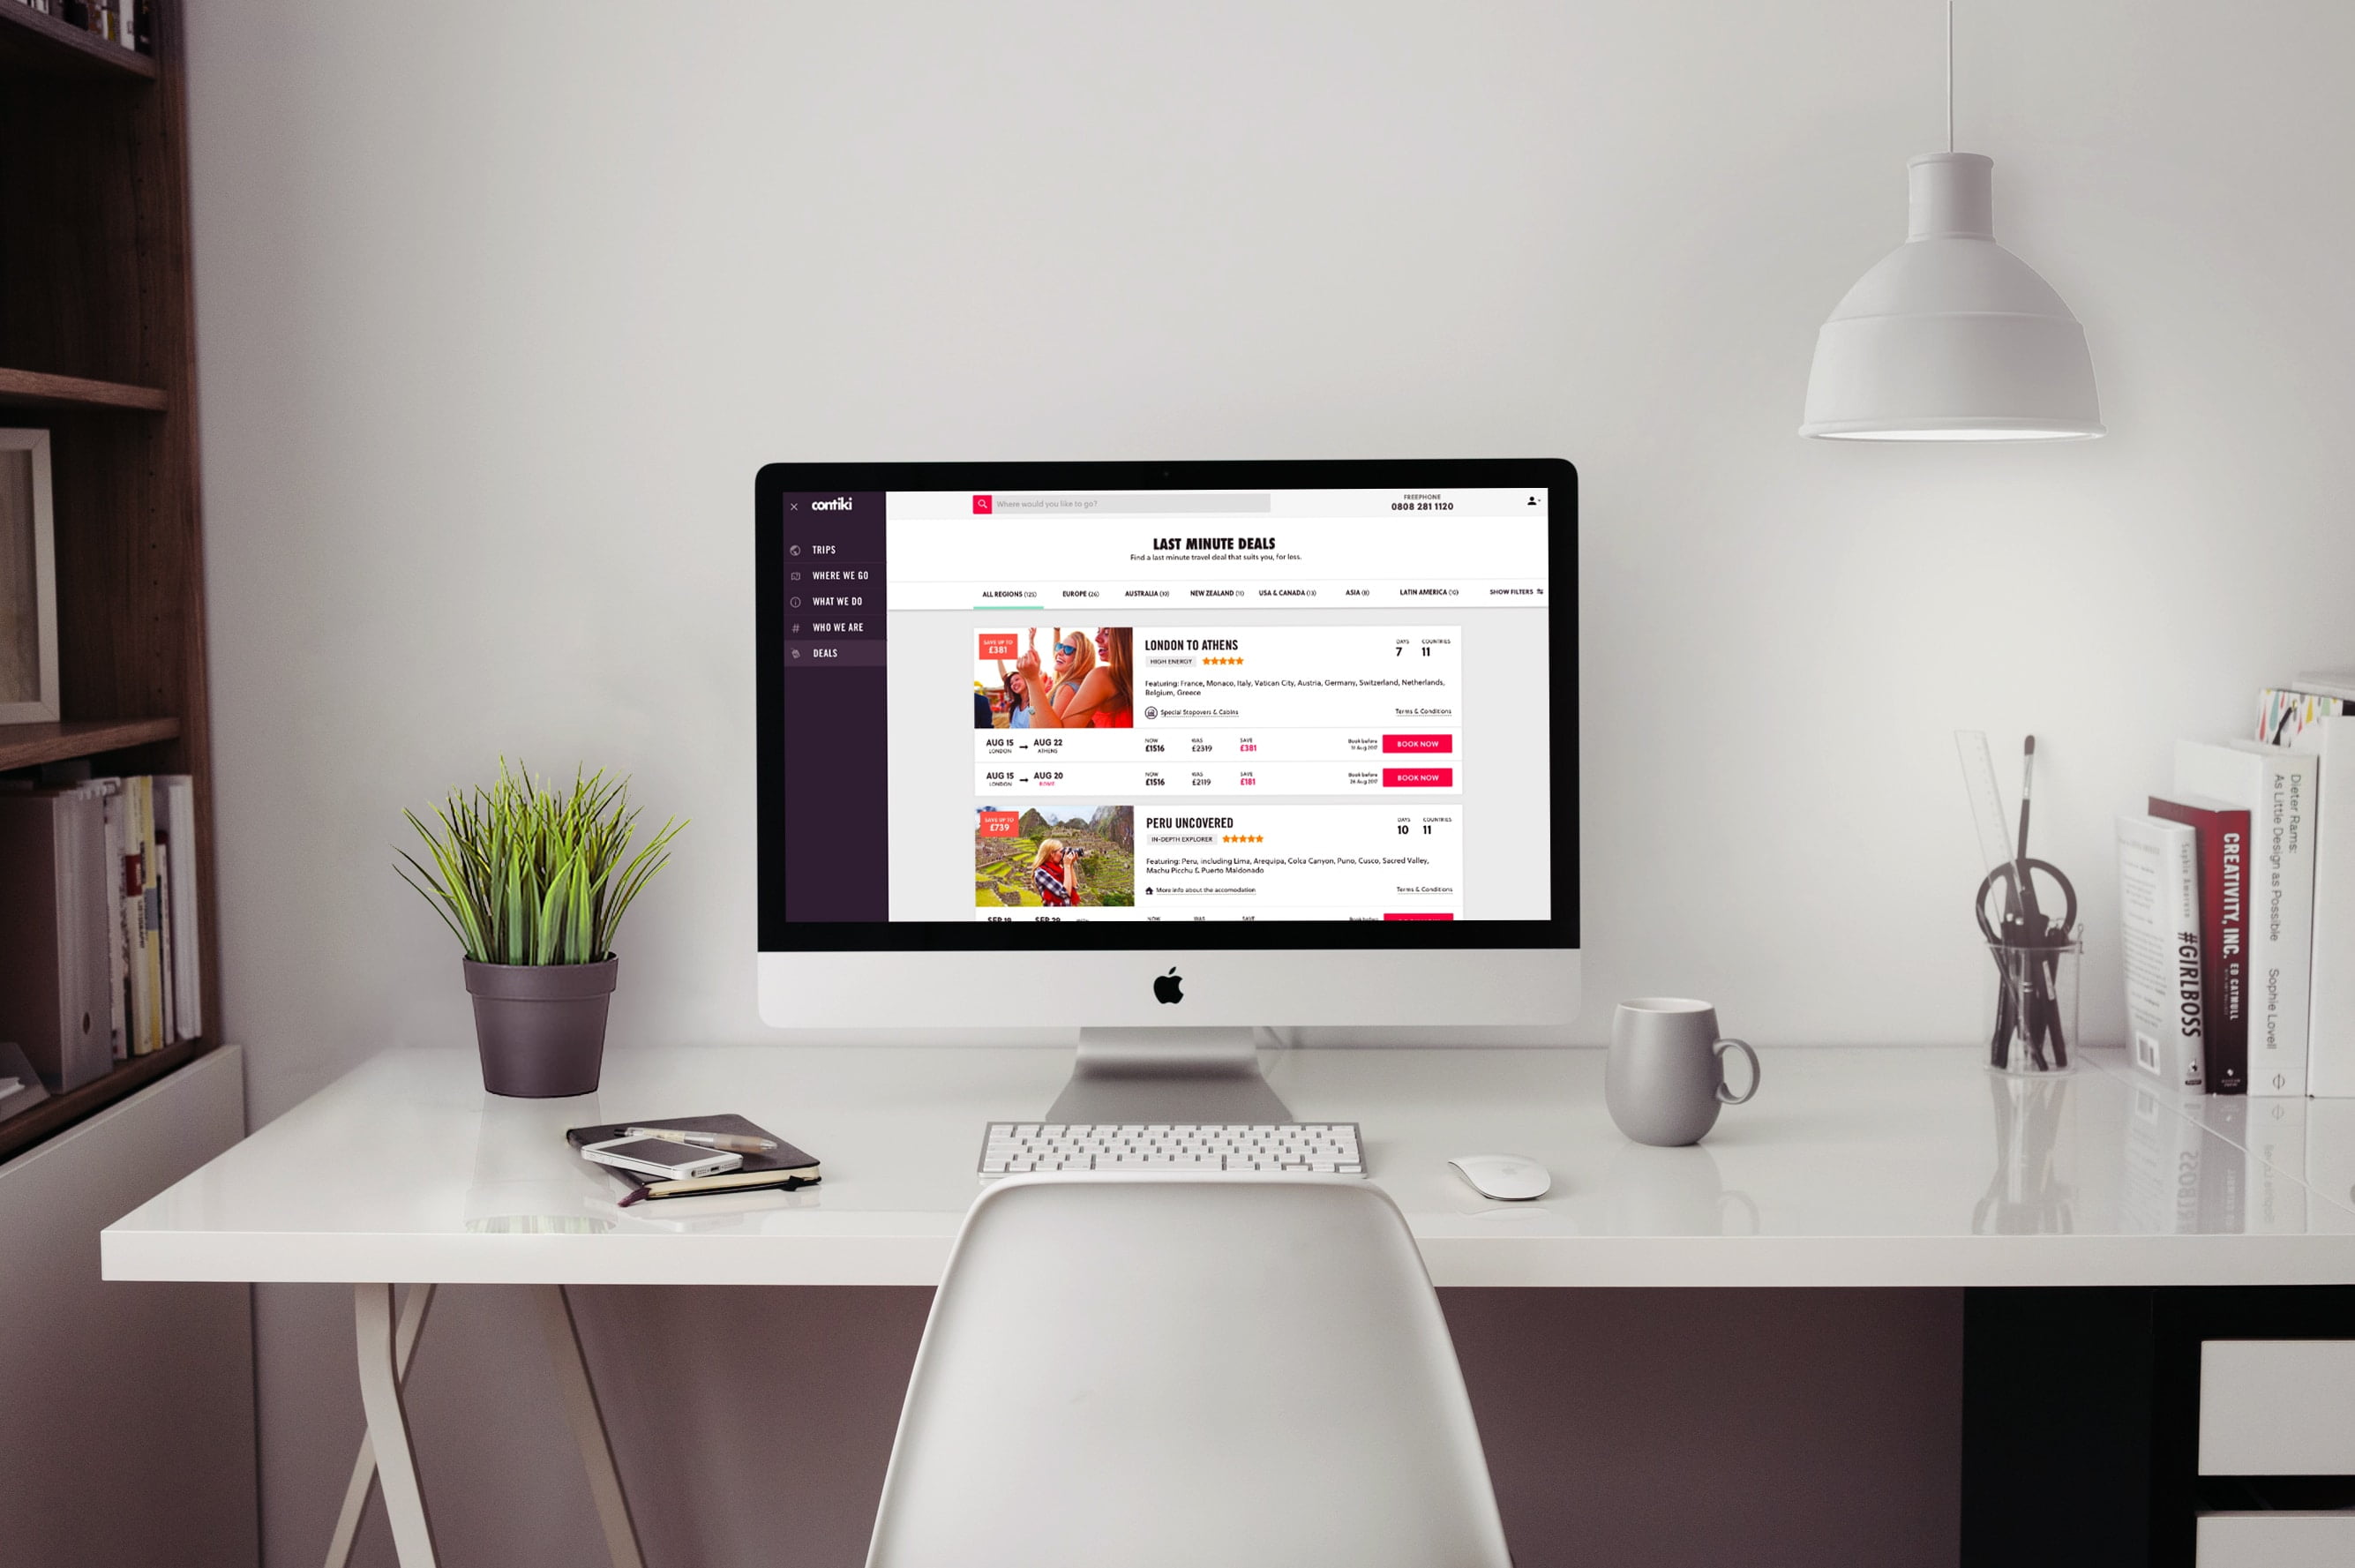
In this ab test, the element in question is a product card, displayed on the search results page while people are looking to purchase a travel product. There is a hypothesis that, if people are not seeing the price on this search card, they would be more likely to browse through more trips that might be of interest to them. After that they choose a product, they would be able to see the price inside the individual trip product page.Environment
- US Market
- 18-35 year-olds
- 80k people participated
- 123k recorded sessions
- 525k pages have been read
- 2 months of data
The objective of the AB test
To analyze which version would lead more people to make a purchase in the US youth travel market.We also wanted to see the user's exit rate from the search results page and how many of them would proceed further in the conversion funnel. Firstly by seeing a trip card on the search results. Secondly selecting a trip and learn more about it.
[yop_poll id="1"]
RELATED: Hard or soft CTA would drive higher progression into a booking funnel?
Analyzing the results of the test
The winning version in this test is Version B. Even though both versions perform almost equally, the version without a price seems to lead to 0.28% more bookings made and 3.46% more leads submitted via the Request More Info link. Also, the version without a price reduces the user's exit rate from the search results page by 4% while increasing the people that proceed from the Search page to a Product page by 0.9%.Highlights of the Winner
| Bookings Made | +0.28% |
| More Info Form Submissions | +3.46% |
| Exit Rate from the Search Results | -4% |
| Users proceeding in the conversion funnel | +0.9% |
Overall, these numbers make sense as if a user doesn’t see the price they are more likely to move through more pages looking for it or submitting a Request More Info form to enquire about pricing while the exit rate improves.See the winning version implemented on contiki.com
What is AB testing?
An AB test is essentially an experiment where two or more variants of a page or an element are shown to users at random, and statistical analysis is used to determine which variation performs better for a given conversion goal.Stay up to date! Join our newsletter!
Join our community today and let the most exciting updates come directly to you. Stories, Design Lab items, discounts, new projects and industry insights – all delivered to your inbox.


